Linear Discriminative Star Coordinates for Exploring Class and Cluster Separation of High Dimensional Data
Computer Graphics Forum (Volume 36, Number 3, 2017)
(Proceedings of EuroVis 2017)
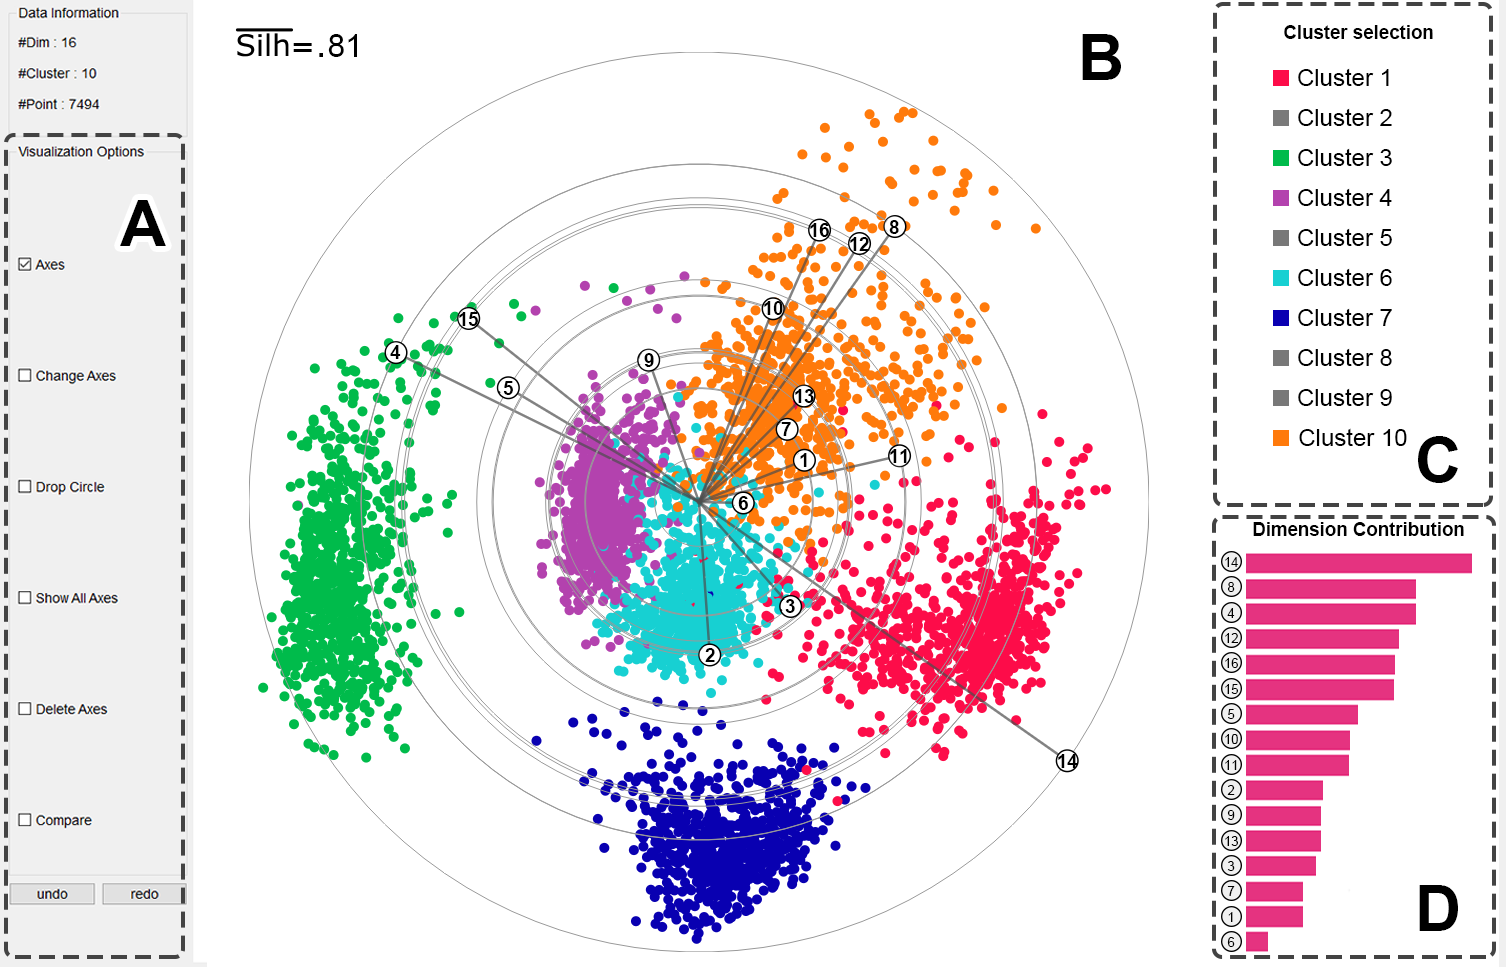
Figure 1: The interface for visual cluster exploration and feature selection: (a) the visualization command view; (b) the DSC view; (c) the cluster selection view; and (d) the bar view. In this example, the six selected classes are well separated in the DSC view, where the un-selected class is indicated by the gray icon in the cluster selection view.
Abstract:
One main task for domain experts in analysing their nD data is to detect and interpret class/cluster separations and outliers. In fact, an important question is, which features/dimensions separate classes best or allow a cluster-based data classification. Common approaches rely on projections from nD to 2D, which comes with some challenges, such as: The space of projection contains an infinite number of items. How to find the right one? The projection approaches suffers from distortions and misleading effects. How to rely to the projected class/cluster separation? The projections involve the complete set of dimensions/features. How to identify irrelevant dimensions? Thus, to address these challenges, we introduce a visual analytics concept for the feature selection based on linear discriminative star coordinates (DSC), which generate optimal cluster separating views in a linear sense for both labeled and unlabeled data. This way the user is able to explore how each dimension contributes to clustering. To support to explore relations between clusters and data dimensions, we provide a set of cluster-aware interactions allowing to smartly iterate through subspaces of both records and features in a guided manner. We demonstrate our features selection approach for optimal cluster/class separation analysis with a couple of experiments on real-life benchmark high-dimensional data sets.Materials:
Paper: [PDF 8.5M].
Results:
 |
 |
 |
 |
| (a) | (b) | (c) | (d) |
 |
 |
 |
 |
| (e) | (f) | (g) | (h) |
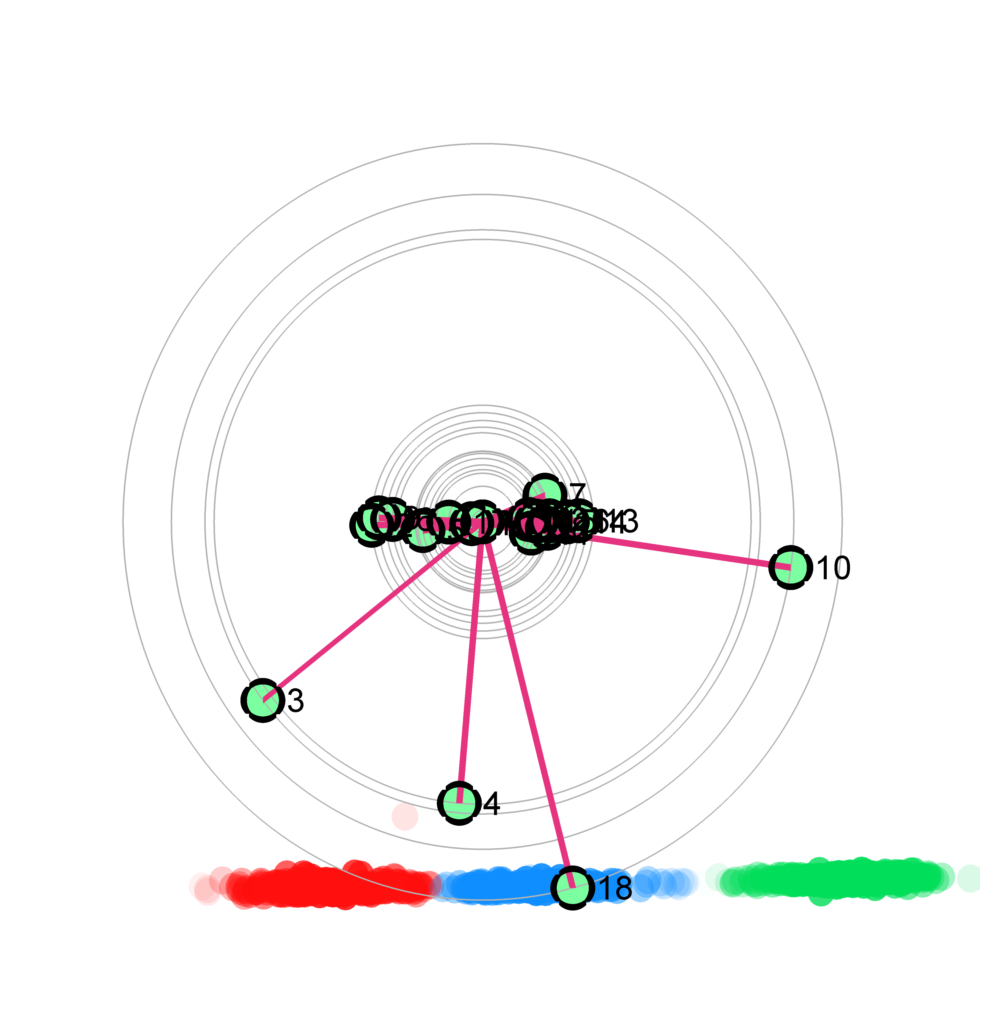
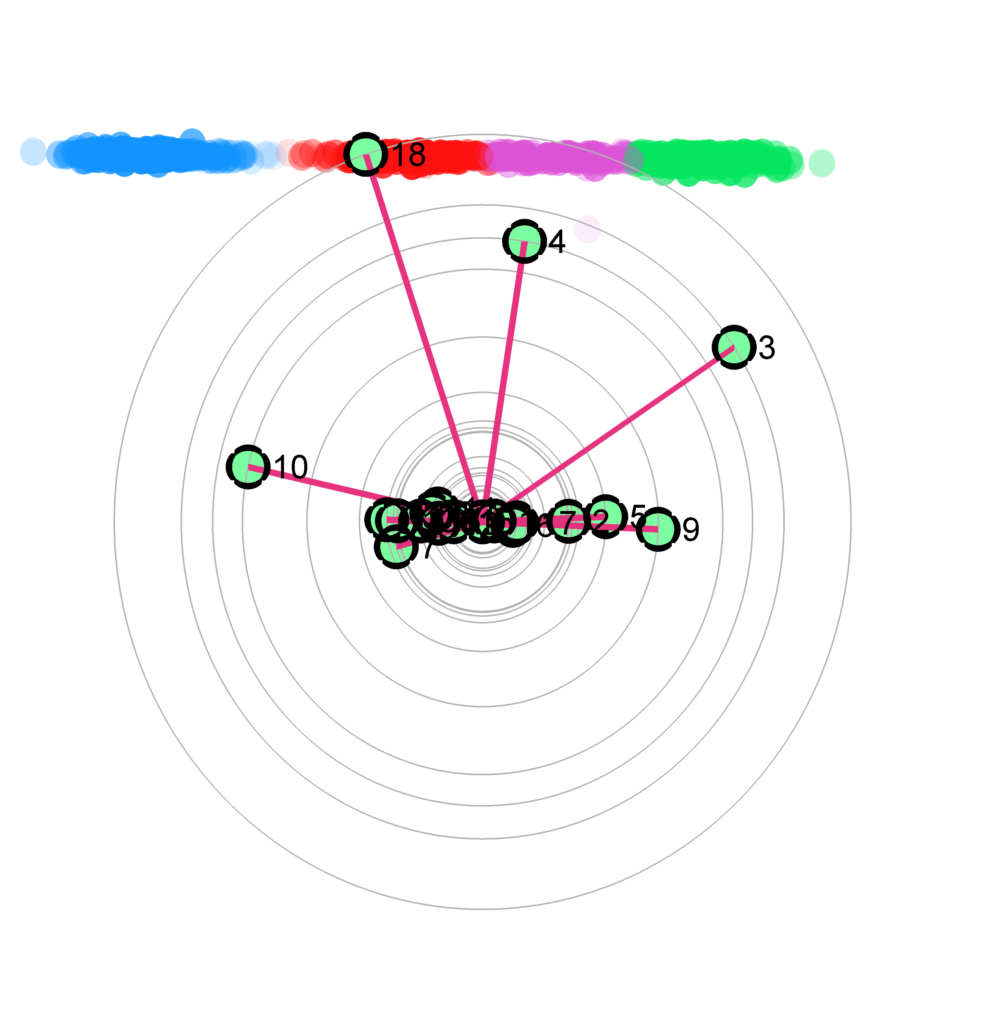
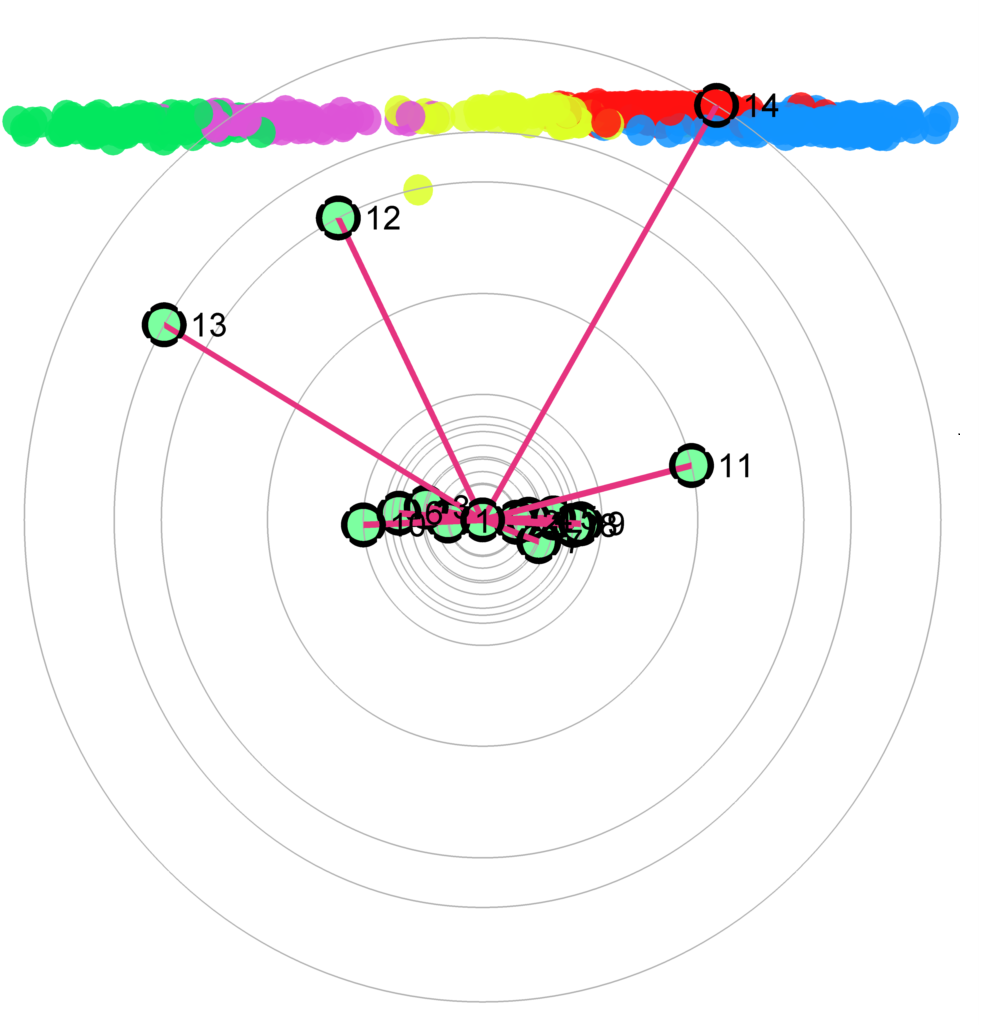
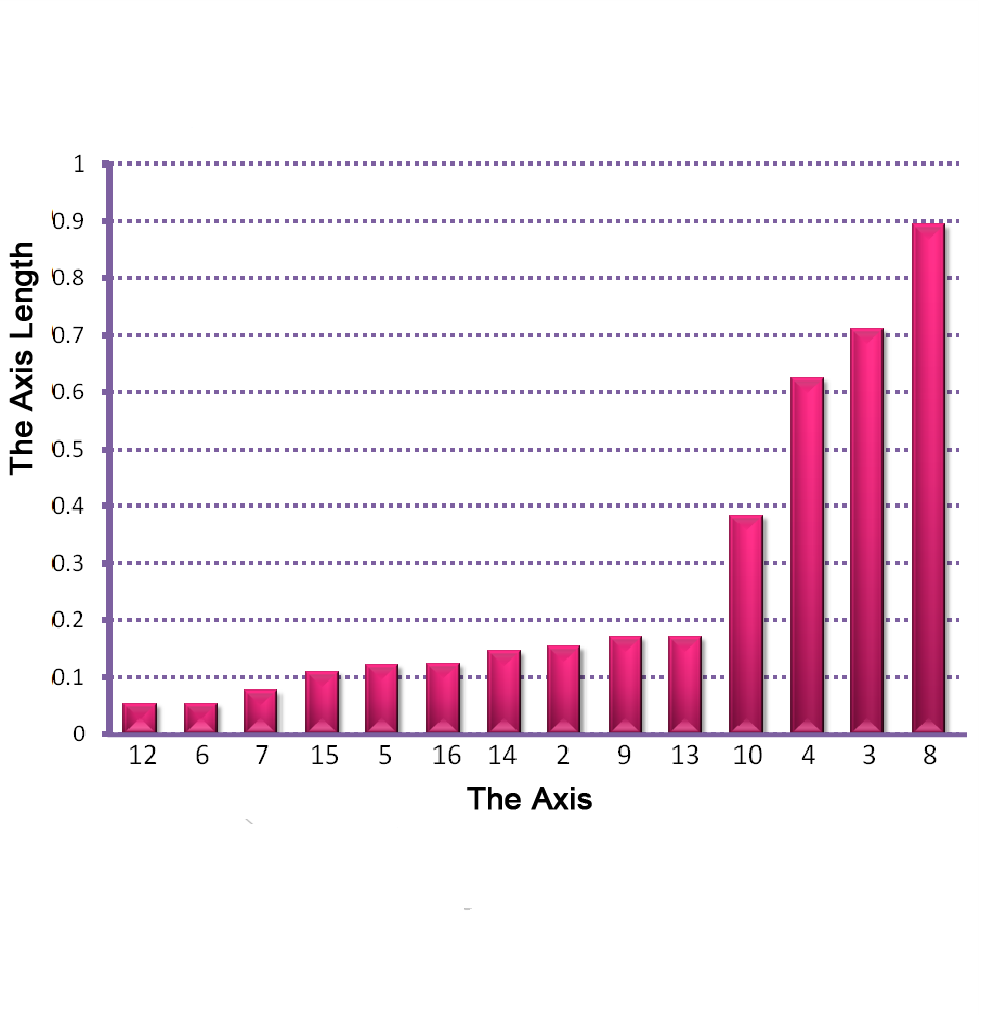
Figure 2: The star coordinates visualization for the unlabeled USDA data set. (a-d) show the star coordinates where the numbers of cluster are set to 3, 4, 5, 6, respectively; (e) the bar chart view of the DSC result in (c); (f,g) the DSC view and the bar chart view generated by removing first four axes whose length are noticeably shorter than the rest shown in (e); (h) The DSC view generated by manipulating the most important 4 axes, allowing the five clusters to be shown more clearly
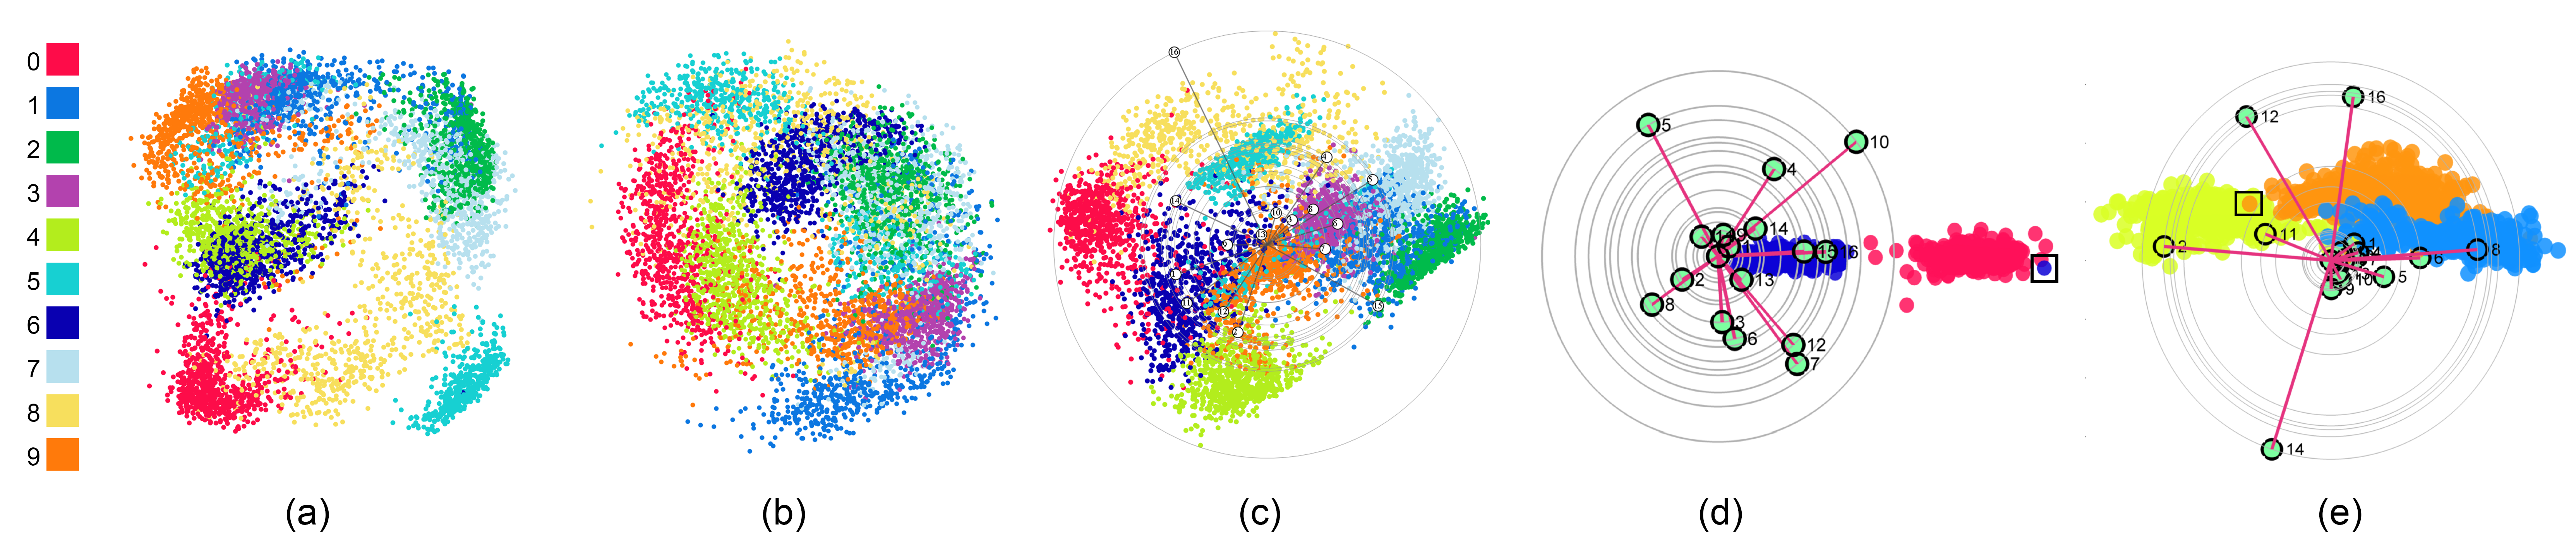
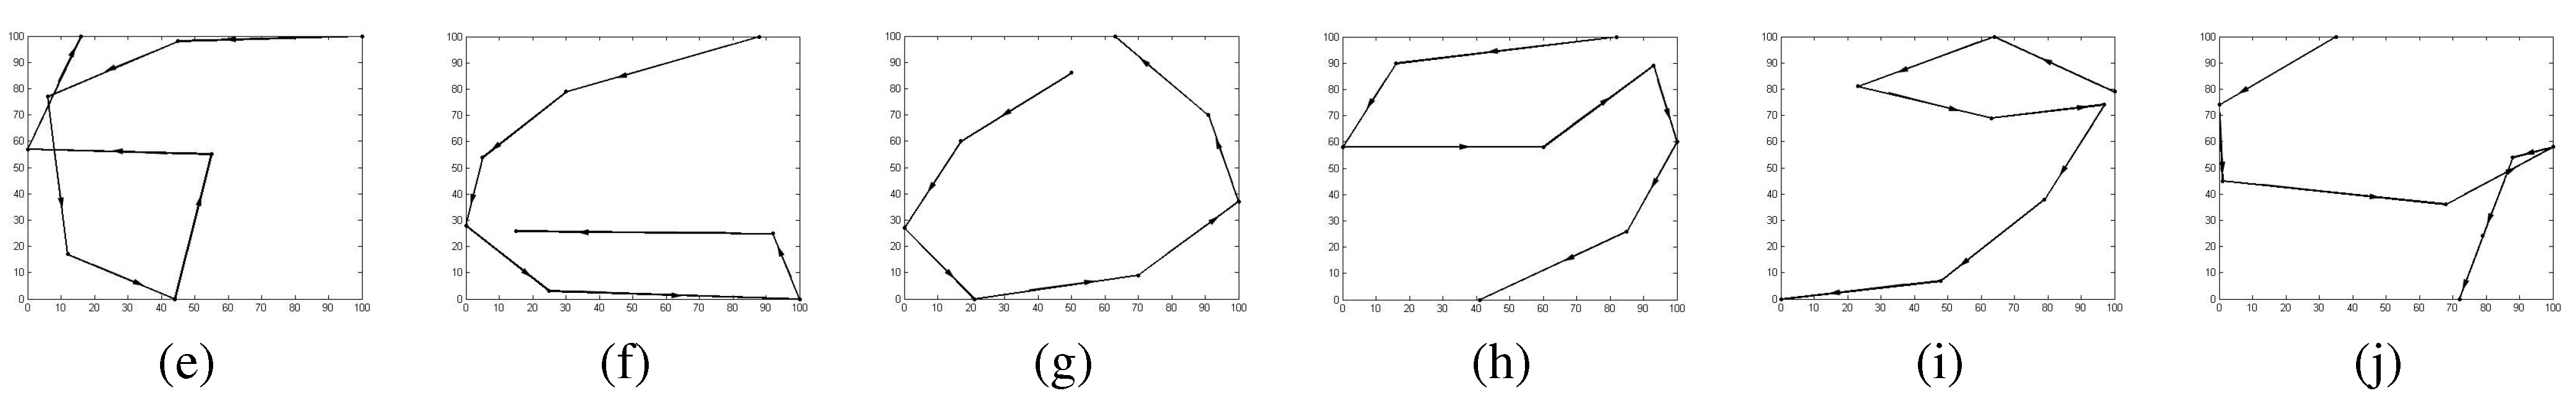
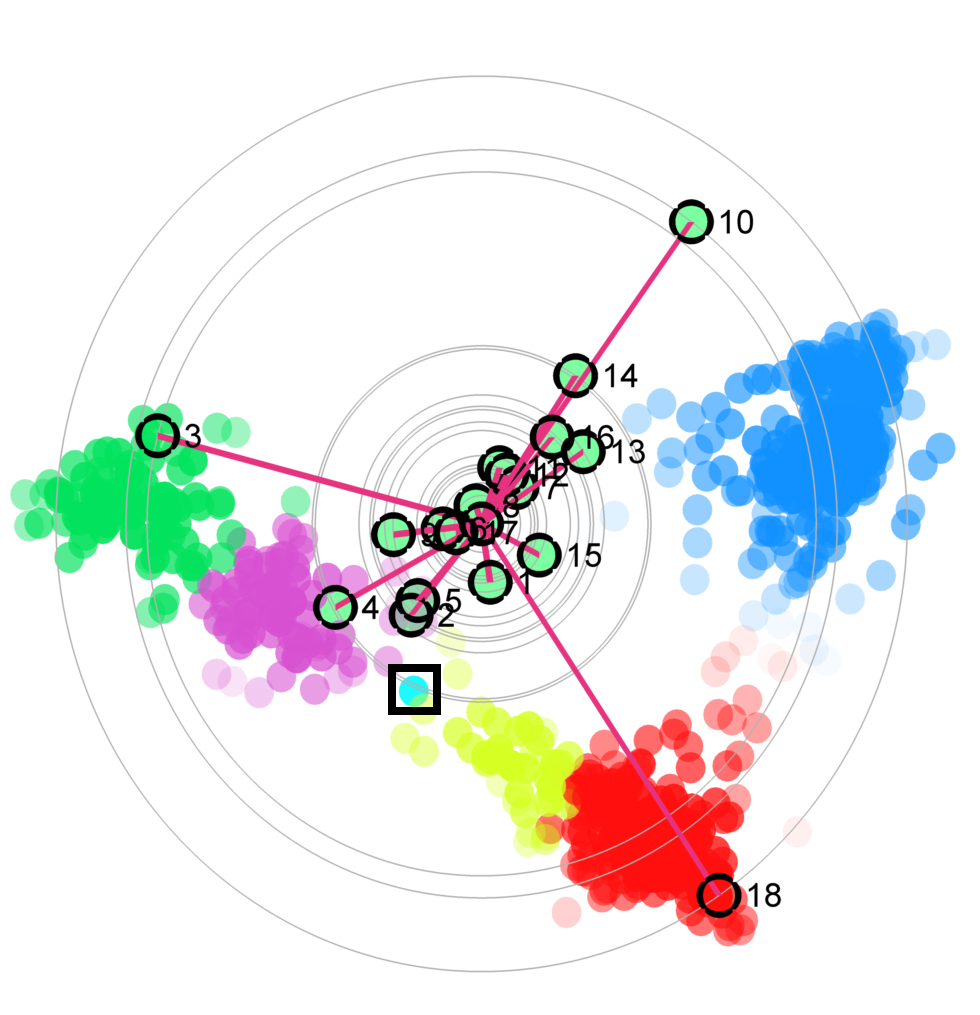
Figure 3:The star coordinates visualization for the labeled PENDIGITS data set, which contains 10 different clusters and each cluster corresponds to a digits. (a) The scatterplot visualization generated by projection pursuit result; (b) The scatterplot visualization generated by the result of the method [VLL11]; (c) The default DSC view; (c) The DSC view generated by zooming in the red and blue clusters (represent 0 and 6, respectively), where the outlier is highlighted with a black box; (d) The DSC view generated by zooming in the yellow, orange and light blue clusters (represent 4, 9, and 1, respectively), where the outlier is highlighted with a black box; (e) The digit 6 corresponding to the highlighted blue outlier in (c); (f,g) The representative samples from the clusters for digits 0 and 6, respectively; (h) The digit 9 corresponding to the highlighted orange outlier in (d); (i,j) The representative samples 9 and 4 from the two clusters, respectively.
Acknowledgement:
This work is supported by the grants of NSFC-Guangdong Joint Fund (U1501255), the National Key Research & Development Plan of China (2016YFB1001404), Shandong Provincial Natural Science Foundation (11150005201602) and the Fundamental Research Funds of Shandong University.